
POS Retail Sales and Inventory Reporting Solutions
Turn Inventory Faster – Forecast More Accurately – Deepen Visibility to Sales
ERS clients are passionate about collecting, integrating and interpreting POS and inventory data to improve their merchandise decision-making ability. Most companies cannot accomplish that on their own. They need expertise, technology and the engagement of knowledgeable experts to make it happen.
Best Practices, Planning Discipline & Process, Data Interpretation, Vendor Managed Inventory, Category Management
Data Collection & Warehousing, POS Analytic Reporting, Custom Software & Dashboards, Forecasting, Augmented Intelligence
Personal Relationships, Extension of Your Team, Training & Coaching, Multiple Report Delivery Methods, Flexibility & Support
A Few Things We’re Great At
We deeply understand the retail industry, sales analysis and inventory planning.
POS Retail Analytics
Uncover opportunities & liabilities in your data.
Inventory Planning
Optimize the flow of retail and wholesale inventory
Forecasting
Stay in stock
Custom Dashboards & Software
Apps that solve your problems quickly and affordably
Vendor Managed Inventory
Smart, automated allocation that optimizes inventory.
Data Warehousing & Integration
One place to store and easily access all your data
All In One Inventory Planning – A Modern Aproach
Everything you need to plan and manage inventory on a platform made for the future.
Easy integration with virtually any ERP system.
Connect 3rd party data including Census Demographics, Weather, other Forecasts.
Kits, Bundles, Parent-Child scenarios, Shared Inventory.
Customizable parameters and business rules.
Price Elasticty.
Baked in Retail and Wholesale Planning Expertise.
The Launchpad
The start page- fully customizable for your business. Shows the key information you need- sales and inventory. Year over Year, Week over Week, any time period. Custom attributes and channel information. Buttons that take you directly to the functions you need.
Monthly Demand Plan
Projected inventory by month with estimated sales and recommended buys. Lead time, WIP, seasonality and other smart features make it accurate and easy to use. A Buy sheet that contains units, cost and whatever information you require to place orders.
Alerts
An intelligent system that quantifies lost sales, inventory above and below targets and creates a priority list to take action. Items and stores most predicted to be out of stock.
Item Performance with Recommended Actions
The reports show you what to do based on an advanced ranking system and inventory health criteria. Created by inventory experts who live and breathe retail and wholesale planning every day.
AI Visualizations
Programmed to find opportunities and liabilities using ERS’ Retail Narrative engine. It also takes advantage of Microsoft’s powerful AI models to find trends in your data.
See Where Your Inventory is Going
Projected inventory to see how long you will be in or out of stock by item.
Helping Clients Achieve Their Goals
Client Engagement
Many of our client relationships are well over a decade. It’s because we are engaged with them and constantly strive to help them achieve their goals.
Solutions
We understand that every client is slightly different. Even though their challenges may be similar to other clients, the way we approach it is flexible.
What works best for your organization?
Our software business benefits greatly from our consulting business and vice versa. Consulting clients get the benefit of the results of sophisticated software tools without having to use it. Our software clients get 24/7 access to those tools. And both get the benefit of being able to talk to a consultant.
We complement or act as your planning team. We know what questions to ask and live and breathe retail planning every day.
Complete tool kit for planners, buyers and suppliers. POS analytics, reporting, dashboards, forecasting and more.
Our Ecosystem
Our solutions work for RETAILERS, SUPPLIERS, LICENSORS, DISTRIBUTORS and BRANDS. Data can be integrated between them for the ultimate in data and information sharing.
What Some of Our Customers Say


Are You Leaving Money on the Table? Determine your Lost Sales
Pinpoint opportunities to improve in-stocks and forecasting accuracy by quantifying lost sales with our Lost Sales reporting and Dashboards.
It starts with the data
Smart companies manage inventory by the numbers, not by chance.
Optimize the gathering, managing & interpretation of retail data.
POS Data Management: We’ll help you collect, scrub, scrutinize and validate all your POS data. We can integrate it with wholesale inventory or any other 3rd party data on one platform.
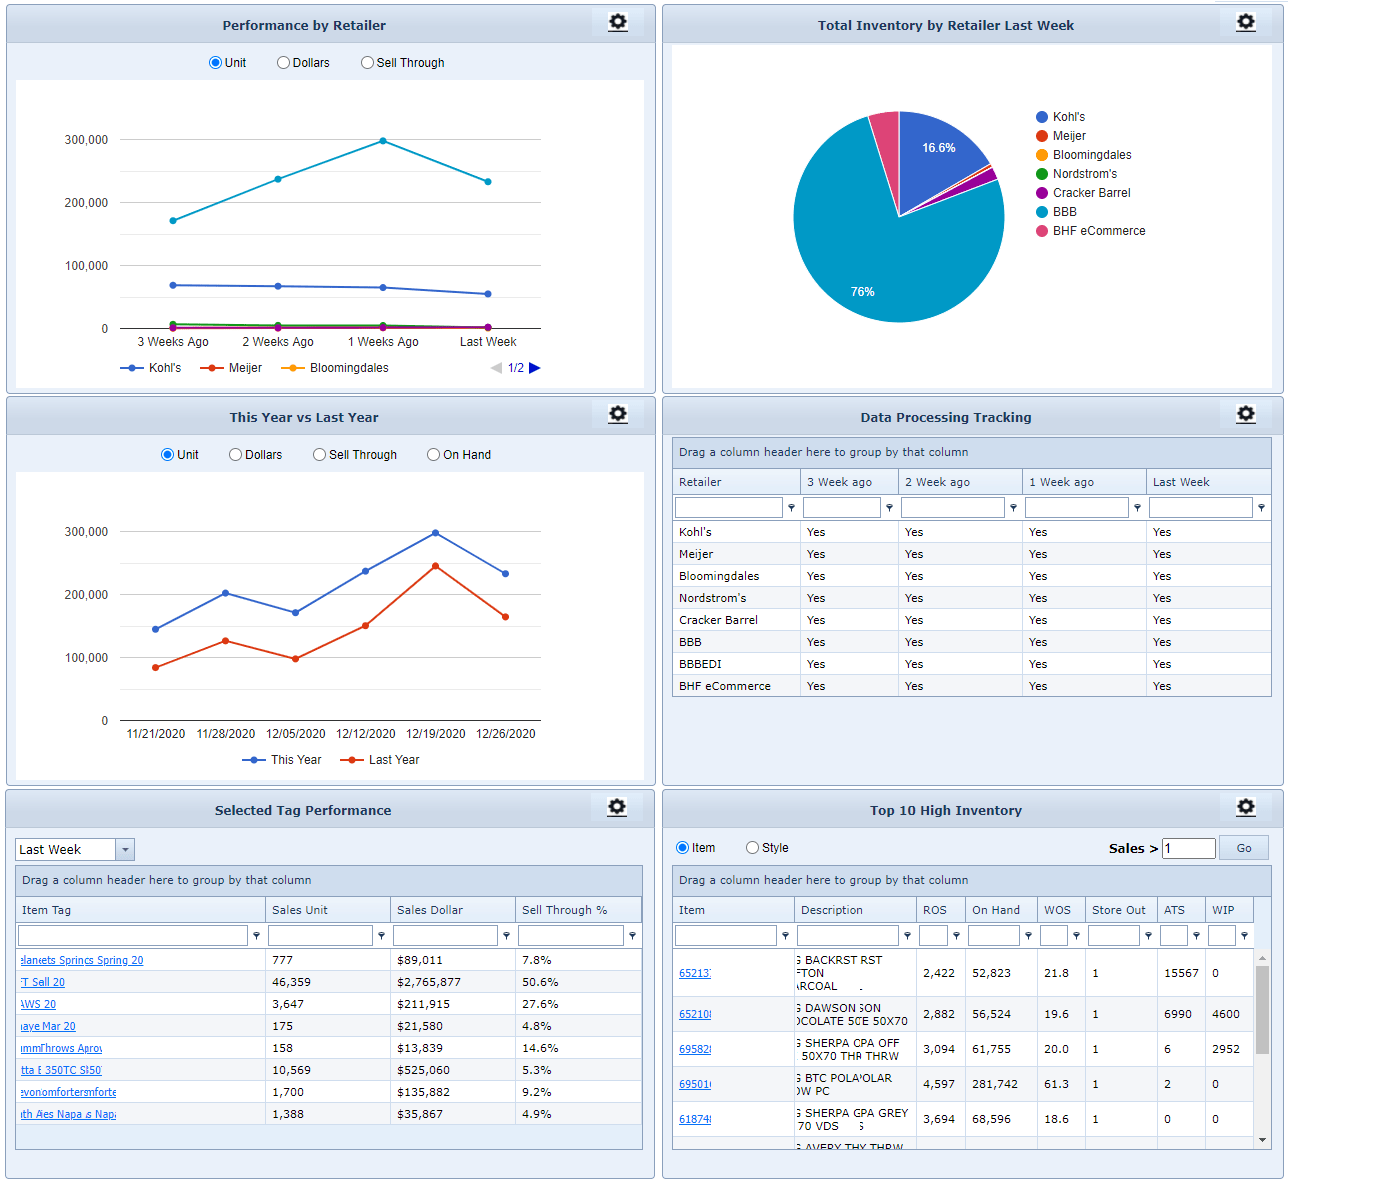
A paradigm change in POS reporting and Retail Analytics
We built a system that does the analysis for you.